What weather should we expect?
At the time of writing, it is just 9 months until the wedding! The nature of the Earth’s atmosphere means that at seasonal timescales it isn’t possible to try and predict the specific weather conditions that could occur on the day. However, there are types of weather prediction specially developed for the long range (called subseasonal, seasonal and decadal prediction), which can be used to inform us if we should expect a greater than usual chance of higher temperatures, windy or rainy conditions. There is also a great deal that we can learn from looking at historical weather records.
The code and references to data sources for the analysis on this page can be found here: https://gitlab.com/jamesfallon/wedding-weather-watch
Climatology (using Met Office HadUK-grid data)
To create a long-running dataset, the HadUK-grid dataset produced by the Met Office combines meteorological observations onto a uniform grid (1km x 1km across the UK) to provide complete and consistent data. We can use this website to understand weather at the wedding venue in previous years.
Here is a figure showing the maximum daily air temperature maximum reached in August 2025:
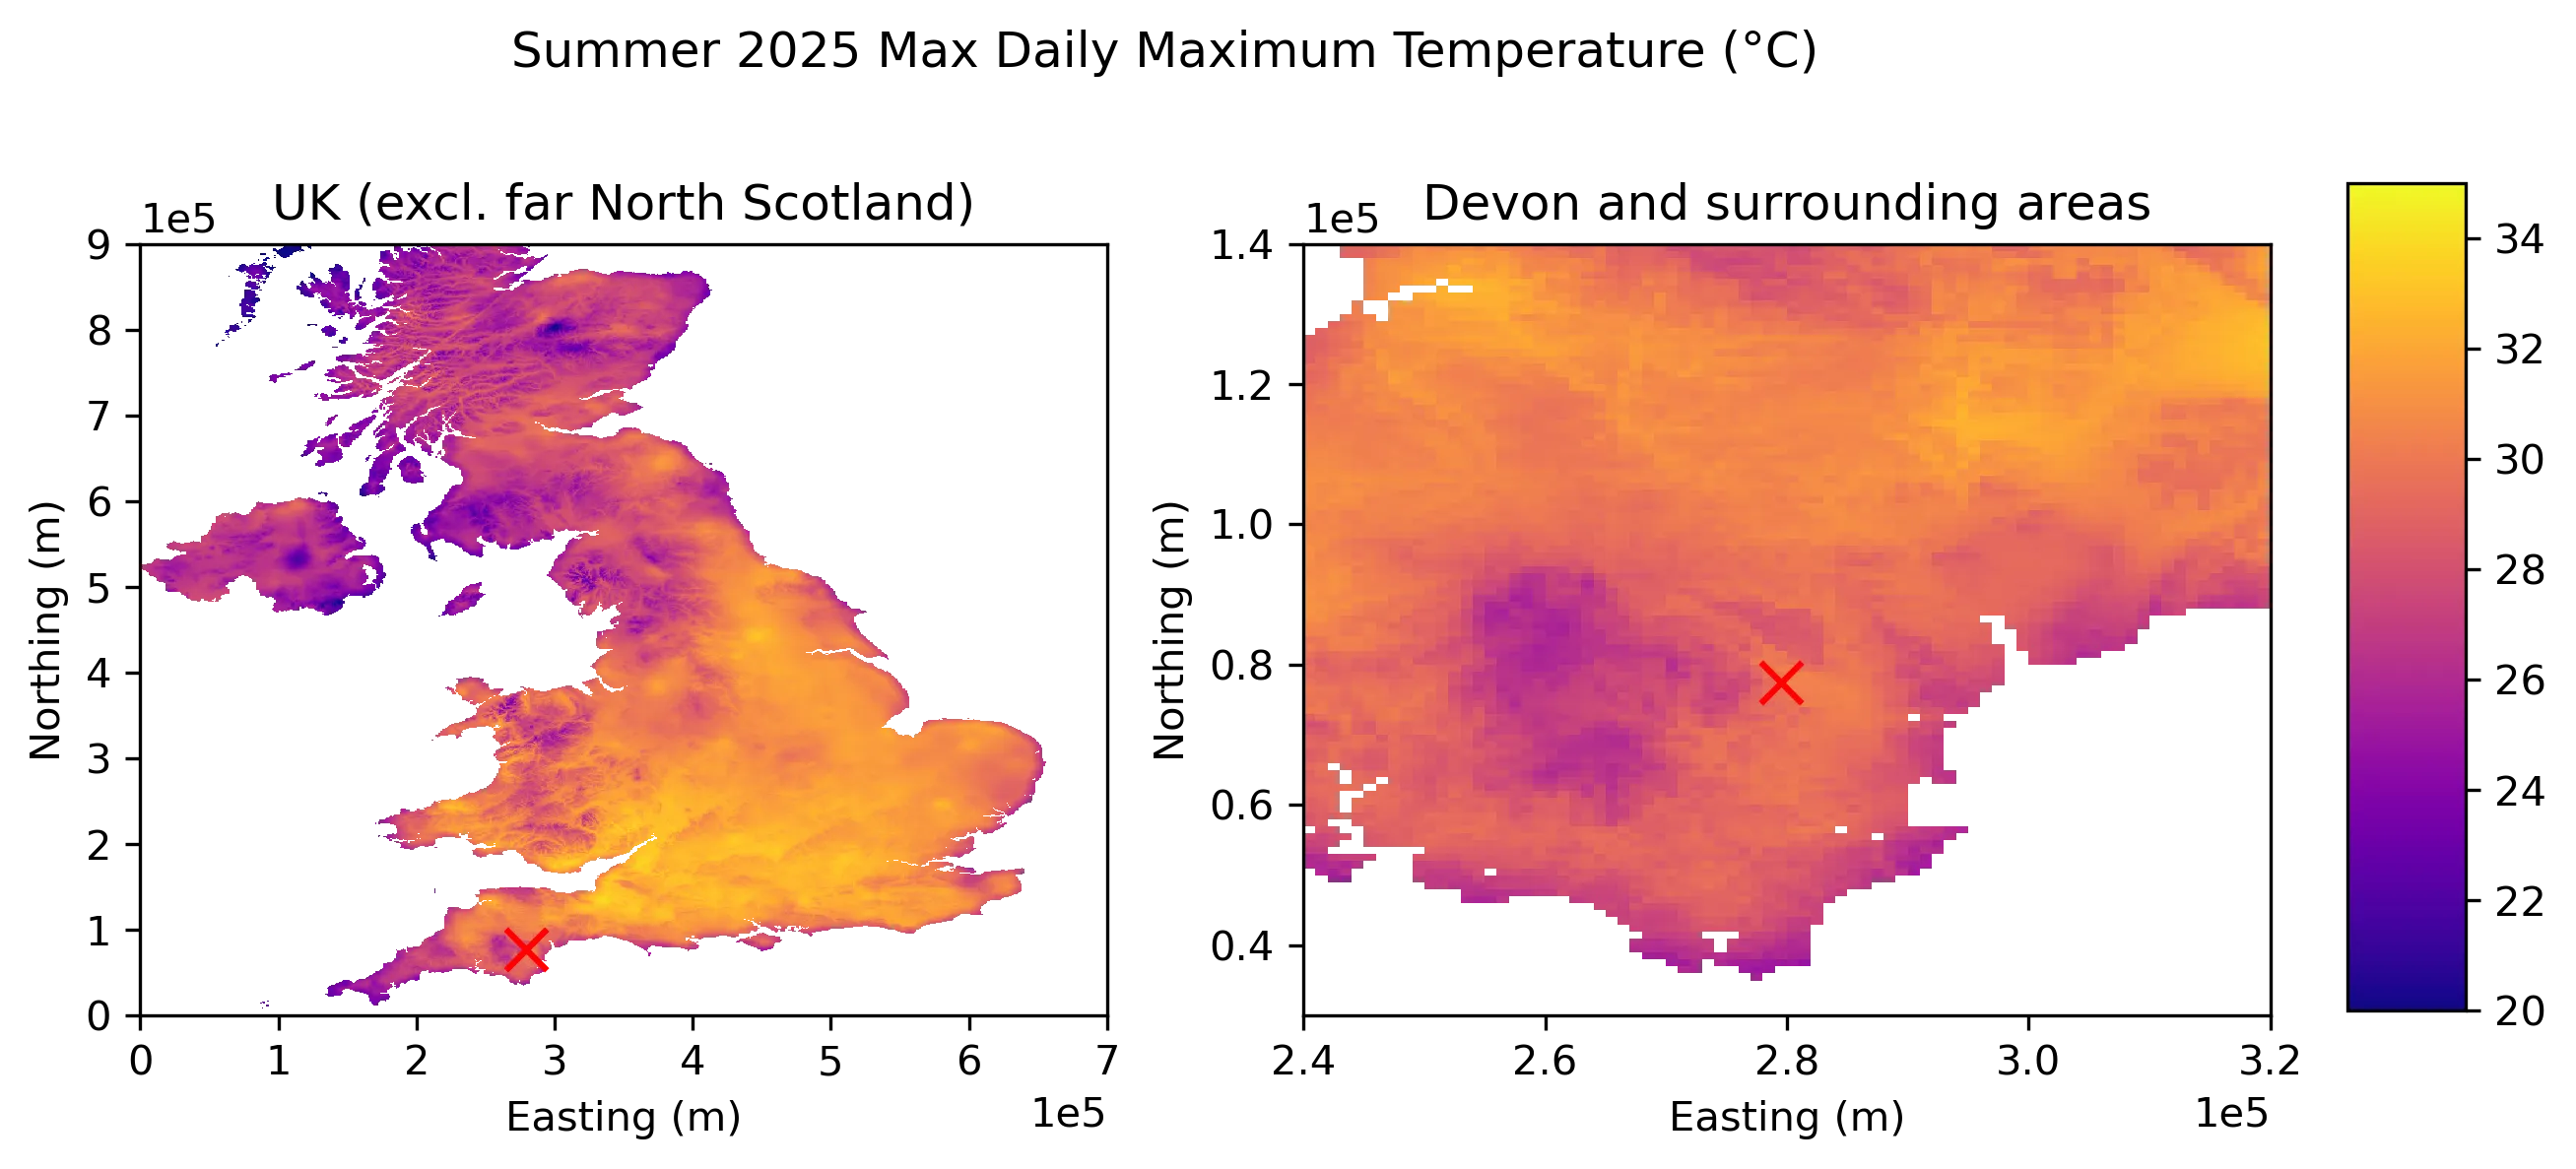
HadUK-grid observations of the 2025 summer maximum daily maximum air temperature across the UK (left) and Devon (right).
August 2025 was a month of contrasts, with the UK experiencing storms, heatwaves and drought conditions! It was also the culmination of the warmest summer on record for the UK surpassing all records dating back to 1884.
Climatology site-specific statistics
Using historical observations for the 1km box corresponding to Colehayes Park, we can build up a probability distribution of daily maximum summer temperatures experienced at the venue
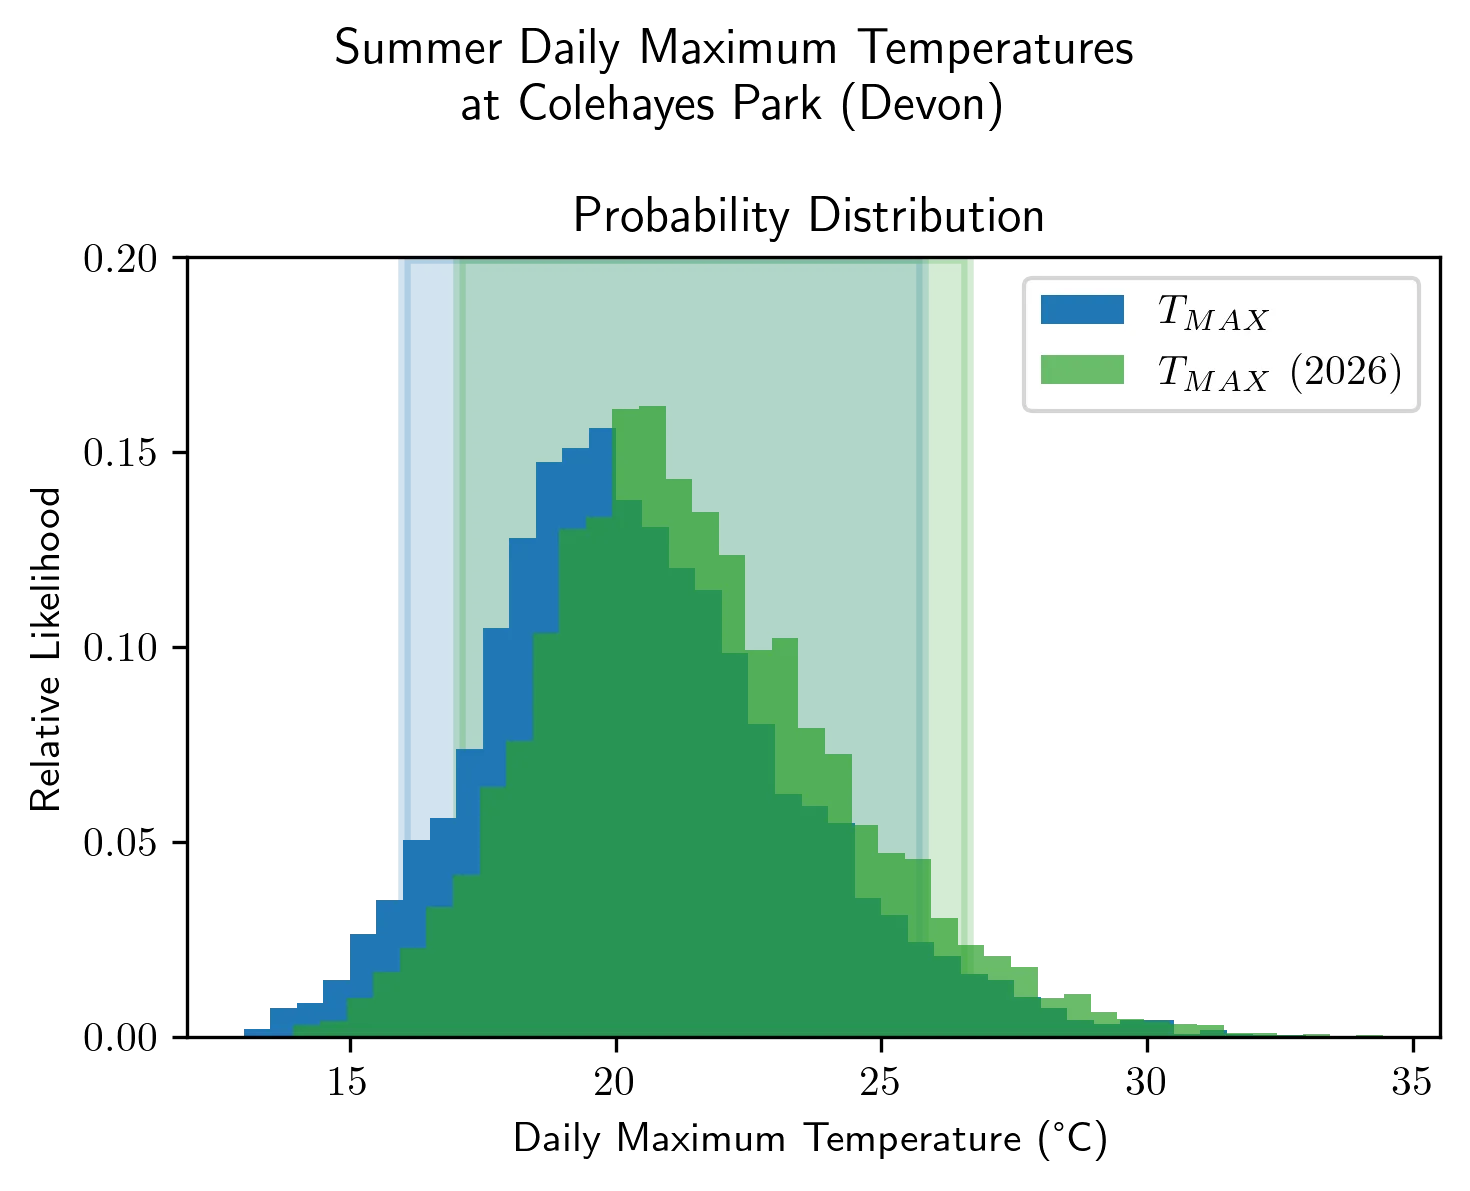
HadUK-grid observations of August daily maximum air temperature at Colehayes Park. Shown in blue are the actual historical observations (maximum temperature of days in August 1961-2025) and in green are the historical observations with a climate change ‘delta shift’ to 2026. The 5th-95th percentile ranges are also shaded between vertical bars in blue and green.
A delta-shift is used to add on the climate change signal into the historical data (blue) to produce a more representative probability distribution of the current climate (green). The shift to higher temperatures is reflective of the underlying climate change trend, however, taking such an approach is likely to underestimate the extreme values which are known to disproportionately increase with a warming climate. (Keep this in mind for the following section!)
The temperature record of all 15th of August occurrences 1960-2025 at Colehayes Park is:
| Temperature max (°C) | Temperature min (°C) | |
|---|---|---|
| Average (±1σ) | 22.11 (±2.48) | 12.80 (±2.14) |
| Lowest recorded | 18.15 | 8.18 |
| 25th percentile | 20.15 | 11.17 |
| 50th percentile | 21.86 | 12.99 |
| 75th percentile | 23.26 | 14.26 |
| Highest recorded | 29.38 | 17.83 |
Having adjusted for 2026 long-term trend due to climate change, if we assume that this is a representative sample of temperature minimum/maximum values and that the wedding day temperature is independent of any other factors, then the statistics imply a 50:50 (coin flip) chance of a maximum temperature of 21.86°C. Equally, there is a coin flip chance that the maximum temperature will be below this value.
Extreme Value Analysis
Extreme value analysis supports studying the extreme values in datasets, including for calculating extreme temperature return periods.
Applying these methods to the Colehayes temperature dataset from before shows the likelihood of different threshold values of temperature being exceeded. These are framed in terms of return periods, i.e. whether it is a 1-in-2-years occurrence, 1-in-10-years occurrence, etc.
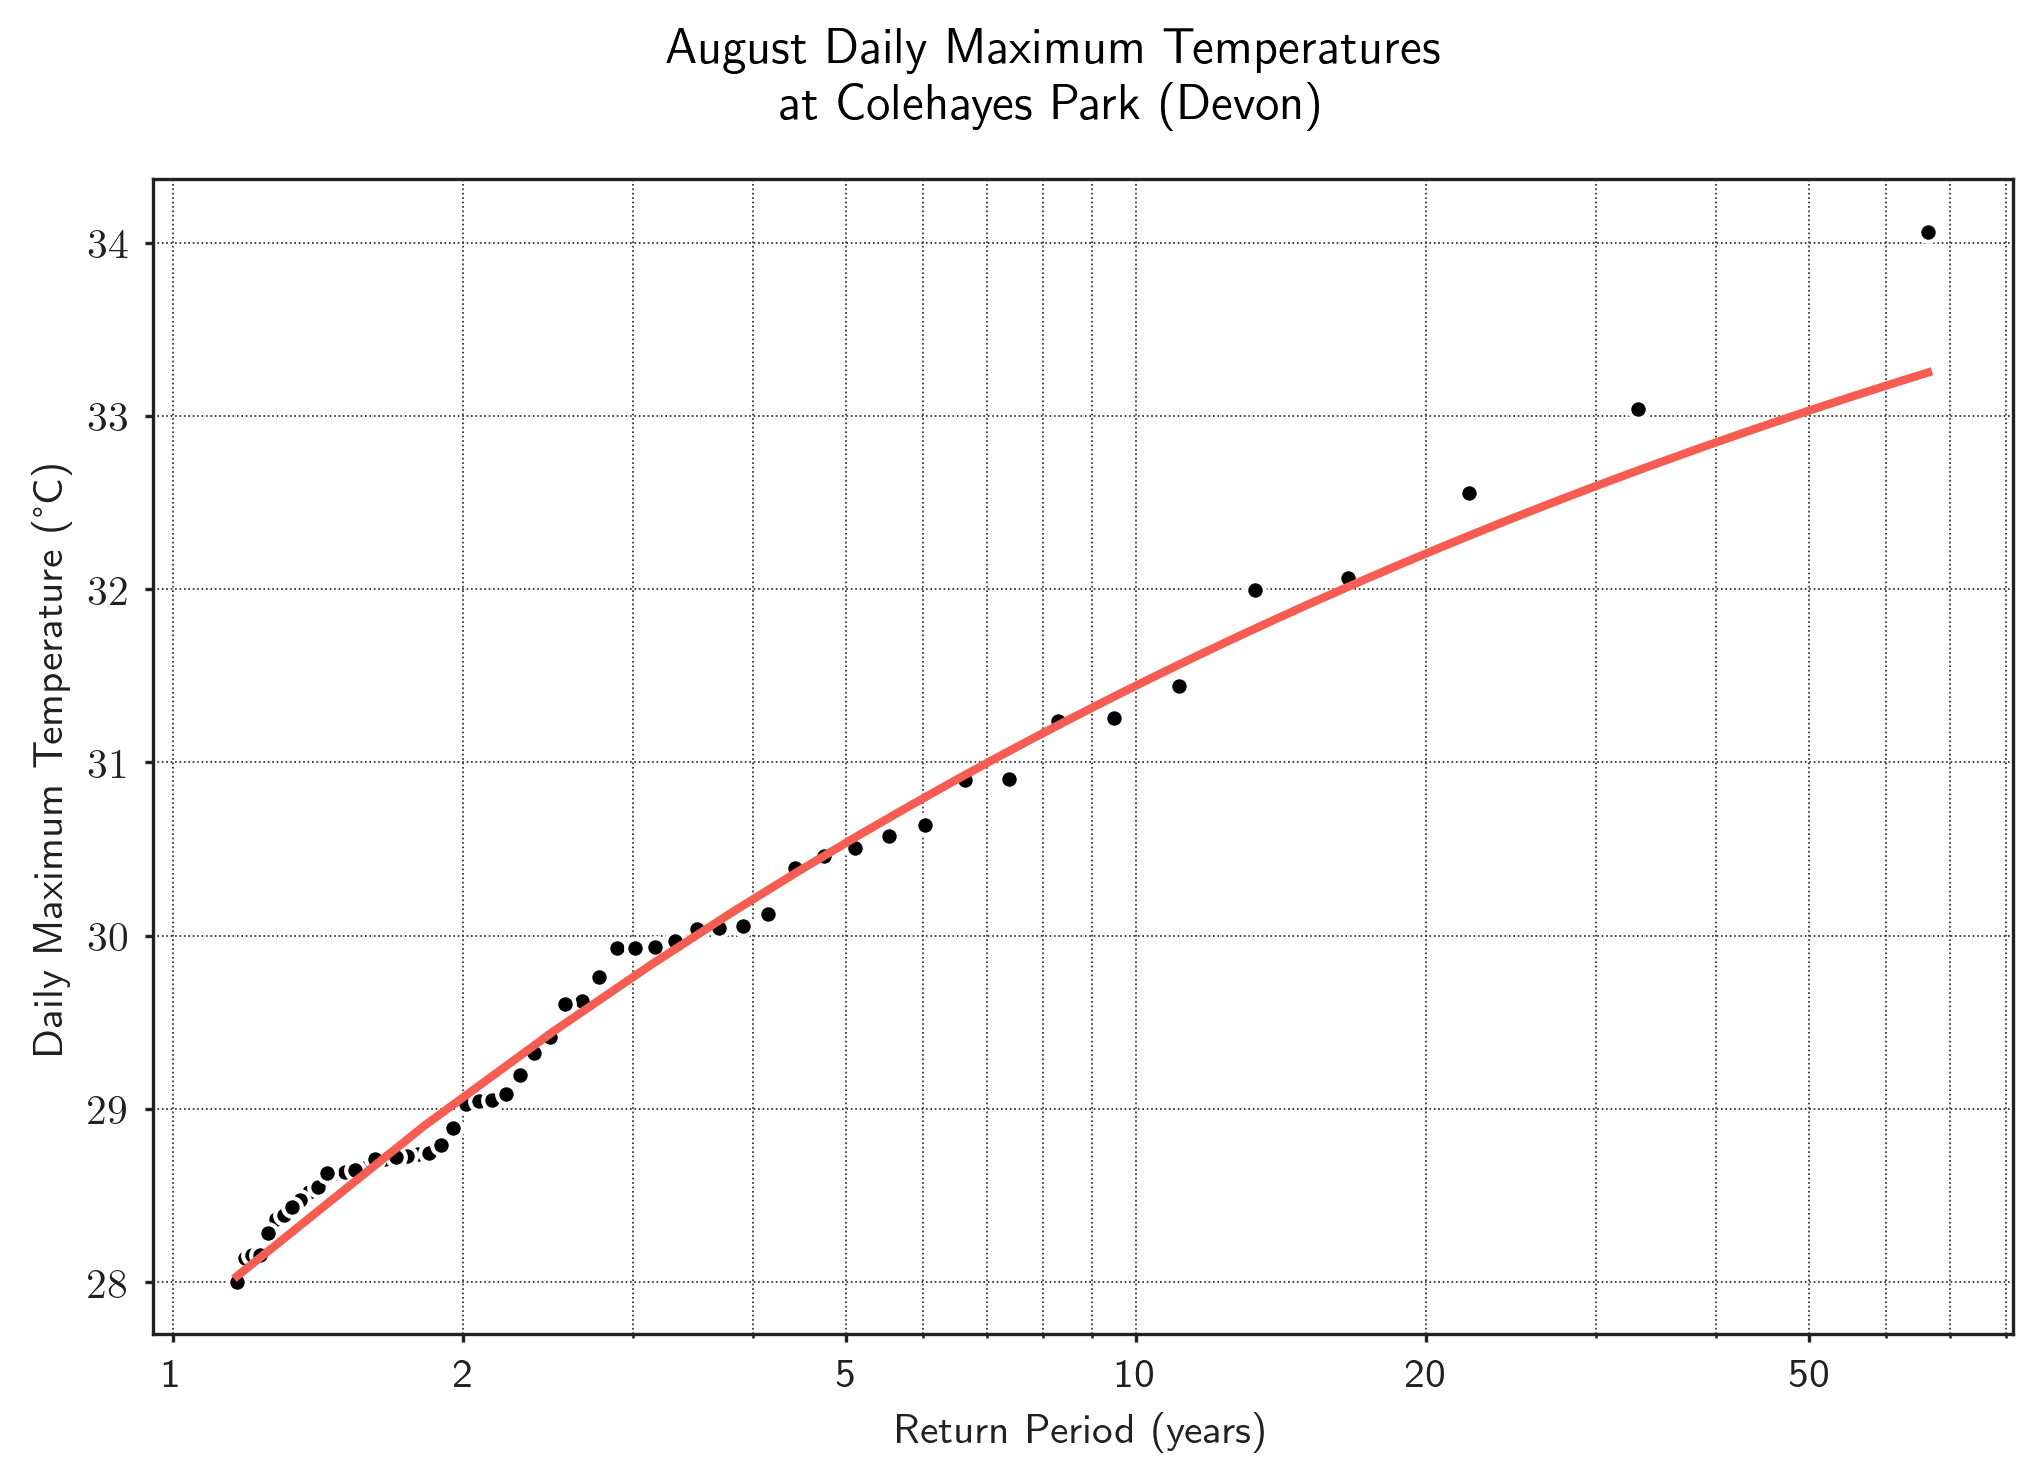
HadUK-grid summer observations at Colehayes, projected to extreme values using a generalised extreme value distribution.
These results show us that we should expect temperatures at Colehayes to reach at least 28C at some point over the summer. Temperatures exceeding 30C are not out of the question, but less likely to occur in a given year or precisely on the wedding day.
More coming soon
More updates coming soon, including long-range weather prediction, the WMO decadal forecast, Met Office 3-month outlook, and a look at precipitation (how likely is it to rain on our parade?!).
Disclaimer
The sources linked to on this page are trusted providers of weather and climate information. However, the interpretation and commentary given here have not been reviewed, and are provided for entertainment and personal use only. All calculations were done using publicly available data and processed on my own laptop - open source python notebooks containing these and other plots to be published soon.